SLCG Economic Consulting's Logo

Blog

RIA Insurance Mandates Didn't Reduce Access to Advisory Services

By Craig McCann and Chuan Qin

You can download a PDF of this article to print or email here

Introduction

Errors and omissions (E&O) insurance can help fund resolution of customer complaints against investment advisers. Many advisors are not insured or have minimal insurance, choosing to fund settlements and awards directly at the risk a particularly costly resolution might bankrupt the advisor. When advisors are unable to pay an adverse judgment, the investor suffers more than the advisor since many advisors and brokers simply move to a new firm when their prior employer folds. Even when resolutions don't jeopardize an uninsured firm, the lack of insurance and the potential inability to pay full restitution is frequently used in negotiations to hold down settlements which fall far short of making investors whole.

Investment advisers are not typically required to maintain an E&O insurance policy with two notable exceptions. In Oregon, a law requiring investment advisers with a principal place of business in Oregon to have an E&O insurance policy in an amount of at least $1 million went into effect on July 31, 2018. Oklahoma followed suit, passing a similar law which became operative on November 1, 2020.[1]

While the E&O insurance requirement is beneficial for wronged clients, it raises investment advisers' cost of doing business and could reduce investors' access to advisory services by driving some advisers out of the states requiring insurance.

We empirically examine the impact of state-mandated E&O insurance coverage on access to investment advisory services, measured by the number of investment adviser representatives (IAR) registered in a state per capita.[2] The IAR registration data is sourced from FINRA's BrokerCheck and SEC's Investment Adviser Public Disclosure (IAPD). Annual state populations are extracted from Census.

We find no evidence that E&O insurance mandates reduce access to investment advisory services. The raw number of registered IARs per capita did not decrease after the law went into effect in Oregon or Oklahoma. More rigorously, a difference-in-difference (DID) analysis shows that the per capita number of IARs in Oregon and Oklahoma did not fall relative to other US states after the laws requiring insurance became effective.

The DID estimate, which measures the impact of the E&O insurance mandate on the number of IARs per capita, is economically small and not significant at any standard significance level. In fact, the estimated impact of the law on registered IARs per capita in either Oregon or Oklahoma is greater than the estimated impact of the same law in at least half of the other US states (which should be zero).

Trends in IAR Registrations

We calculate and analyze the number of IARs registered per 100,000 population (hereafter "IARs per cap") in each state as a proxy for access to financial advisory services.

Oregon

Figure 1 illustrates the number of IARs per capita registered in Oregon at the end of each quarter from September 30, 2016 through June 30, 2020, spanning 2 years before and after the date when the Oregon E&O insurance law went into effect.

Figure 1: IARs Per 100,000 Population in Oregon, September 30, 2016 - June 30, 2020


After the Oregon law became effective on July 31, 2018, the number of IARs per capita briefly remained flat before rising sharply, showing no sign of a negative impact on the supply of investment advisory services.[3] The average number of IARs per capita at quarter end from September 30, 2016 through June 30, 2020 is equal to 96.8.

Oklahoma

Figure 2 displays the number of IARs per capita registered in Oklahoma at quarter ends from December 31, 2018 through September 30, 2022, covering 2 years before and after November 1, 2020 when the Oklahoma law went into effect. The number of IARs per capita in Oklahoma was increasing both before and after the law's implementation, with no indication of any change in the trend in advisor registrations caused by the law. The average number of IARs per capita at quarter end between December 31, 2018 and September 30, 2022 is equal to 64.4.

Figure 2: IARs Per 100,000 Population in Oklahoma, December 31, 2018 - September 30, 2022


The Difference-in-Difference Impact of E&O Insurance Laws

Comparing the number of IARs per capita in Oregon or Oklahoma over periods before and after their law's effective date is not enough to estimate the impact of the law. State IAR registrations may follow national or regional trends which reflect variations in the conditions of advisory service industry, and consequently the number of IARs per capita may change over time absent any mandatory E&O insurance law. To isolate the effect of the E&O insurance law from unobserved trends, we use difference-in-difference (DID) regressions. DID regressions are a standard econometric method commonly used to assess the impact of changes in policy.

The DID method is designed to estimate the impact of a treatment (i.e., implementing the E&O insurance law) applied to some but not all groups. It compares changes in a group which receives the treatment (i.e., Oregon or Oklahoma) to changes in a control group which doesn't receive the treatment. The untreated group's change (in RIAs per capita in our context) surrounding when the treatment group receives the treatment is the baseline against which the change in the treated group (Oregon and Oklahoma in our context) is assessed. If the treated group has changed more (less) than the control group from before to after the treatment, the positive (negative) difference in the changes between treated and control groups reflects a positive (negative) impact of the treatment.

The DID methodology assumes "parallel trends". i.e. if no treatment had occurred, the change in the treated group would have been the same as the change in the control group from before to after the treatment. If the control group fails to follow the same trend as the treated group prior to the treatment (a violation of the assumption), it cannot be used to approximate the treated group had the treatment not occurred.

Impact of the Oregon Law

To gauge the impact of the Oregon law, we consider two control groups of states which never enacted an E&O insurance law as benchmarks for the change in Oregon-registered IARs per capita from before to after July 31, 2018. Figure 3 compares IARs per capita in Oregon against average IARs per capita in (i) all other 49 US states and the District of Columbia and (ii) the 12 Western US states except Oregon.[4] The series of IARs per capita for both the treated group and control group have been centered around zero by subtracting their means.

Figure 3: IARs Per 100,000 Population, Oregon vs. Control Groups


For both control groups, Oregon and the control group follow the same trend over the period of 6 quarters from March 31, 2017 through June 30, 2018, indicating that the parallel trends assumption hold over this period for both control groups.[5] The increasing trend continued for Oregon and both control groups after the law went into effect, although the number of IARs per capita appears to grow slightly more slowly in Oregon than in other US states (left panel of Figure 3). The DID regression determines whether the difference in growth rates between Oregon and states which did not mandate insurance coverage is reliably different from 0.

The DID method estimates the effect of the E&O insurance law on Oregon-registered IARs per capita with the following linear regression:


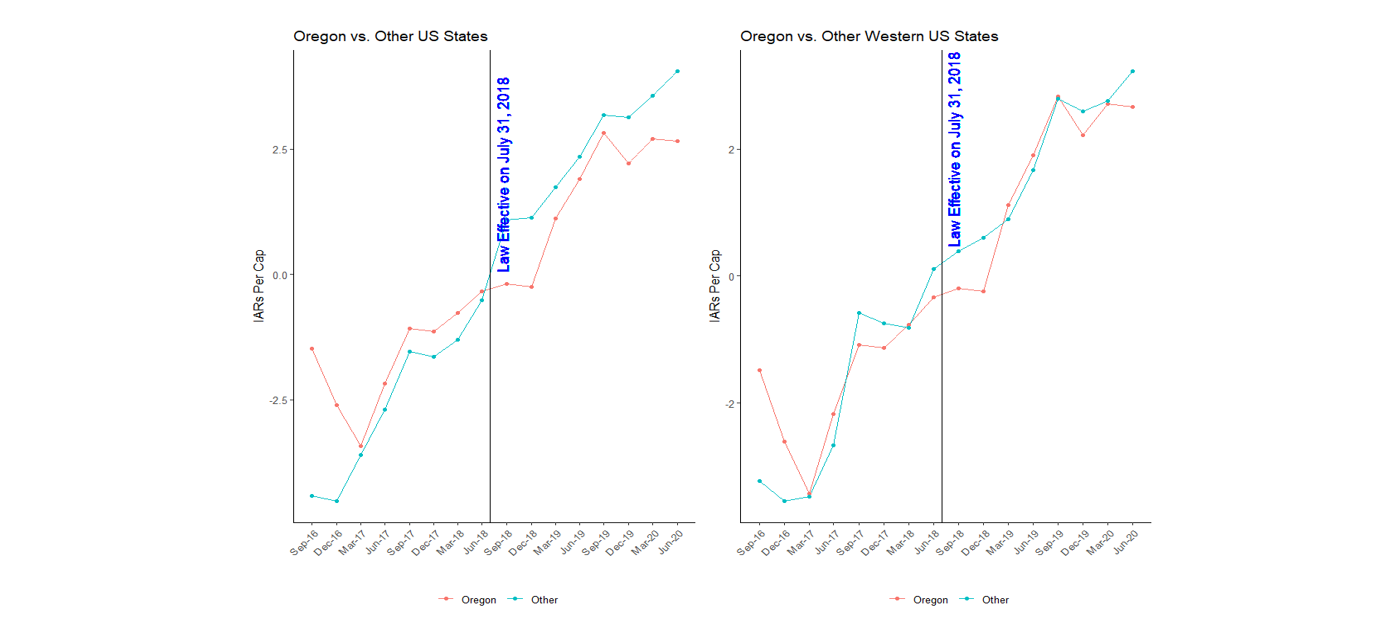
where \(Y_{i,t}\) is the number of IARs in state i in calendar quarter t, \(α_i\)are state dummy variables, \(α_t\) are calendar quarter dummy variables, \(Treated_{i,t}\) is an indicator equal to 1 when state i is Oregon and t is after July 31, 2018, and \(ε_{i,t}\) is a random error term. β is the parameter of interest and measures the effect of the E&O insurance law (treatment) on Oregon-registered IARs per cap. The sample used to estimate the regression includes all the state-quarter observations for all US states plus DC or all Western US states from March 31, 2017 through June 30, 2020, covering the 6 quarters before treatment where the parallel trends assumption is satisfied and 8 quarters after treatment.[6]


The estimate of β obtained using the control group of all other US states plus DC is equal to -1.30 with a standard error of 1.61. This negative estimate is statistically insignificant at any level, indicating that it may well be due to random chance. That is, the DID regression does not support the proposition that the Oregon law reduced access to investment advisory services. The estimated impact is economically as well as statistically small: 1.30 is equal to 1.2% of the overall sample average of the number of IARs per capita (107.6).


To further assess whether the β estimate provides evidence of a negative impact of the Oregon law, we estimate the DID regression 50 more times, each time on the subsample comprising 49 non-Oregon states and DC with a different state as the treated group. For each regression, we assume a hypothetical E&O insurance law became effective on July 31, 2018 in the respective state, while no such law went into effect in 2018 in any state other than Oregon. 29 of the 50 resulting estimates of the impact of the imaginary law are less than -1.30. That is, the β estimate for Oregon, despite being negative, is greater than the estimate of a nonexistent impact more than half of the time. This suggests that the estimate of -1.30 is probably due to chance and cannot substantiate any negative effect of the Oregon E&O insurance law on IAR registrations.


The β estimate based on the control group of all other Western US states is equal to -0.11 with a standard error or 0.90. The estimate is not only statistically insignificant at any level but also economically negligible: 0.11 is merely 0.1% of the overall sample average of the number of IARs per capita (93.3). Among the 12 DID regressions estimated on the sample including 12 non-Oregon Western US states each of which assumes a different treated state, 8 produce a β estimate less than -0.11. This indicates that the negative estimate of -0.11 for Oregon is likely due to chance, and there is no evidence that the Oregon law has a negative impact on IAR registrations.


Impact of the Oklahoma Law

We estimate the impact of Oklahoma law using a similar DID approach with two control groups: (i) all other 49 US states plus DC and (ii) the 16 Southern US states except Oklahoma.[7] Figure 4 compares IARs per capita in Oklahoma with average IARs per capita in each control group from December 2018 through September 2022. The series of IARs per capita for Oklahoma and both control groups are centered around zero by subtracting their means.

Figure 4: IARs Per 100,000 Population, Oklahoma vs. Control Groups


As illustrated by the left panel of Figure 4, the number of IARs per capita in Oklahoma was increasing at a slower rate than the control group comprising all other US states over the entire period of December 2018 - September 2022. Particularly, the national average IARs per capita does not follow the same trend as the Oklahoma-registered IARs per capita before the November 2020 treatment, indicating that the set of all other US states is not an ideal control group for the DID estimation of the impact of the Oklahoma law. The set of all other Southern US states makes a better control group: the series of IARs per capita in Oklahoma and the series of IARs per capita in the other Southern US states are closely aligned over the 1-year period before the treatment, as illustrated in the right panel of Figure 4.

We estimate the regression specified by Equation (1) assuming a treated group of Oklahoma and a treatment occurring on November 1, 2020. The sample used to estimate the regression includes all the state-quarter observations for all Southern US states from December 31, 2019 through September 30, 2022, covering 1 year before treatment where the parallel trends assumption holds and 2 years after treatment.[8]

The β estimate based on the control group of all other Southern US states is equal to -0.29 with a standard error of 0.97. This estimate is not statistically significant at any level, suggesting that the negative estimate may well arise from chance. The estimate is also economically unimportant: 0.29 is equal to 0.3% of the overall sample average of the number of IARs per capita (91.4).

We also run DID regressions on the subsample including 16 Southern US states excluding Oklahoma, assuming a hypothetical E&O insurance law went into effect in each of those states on November 1, 2020. 8 of the 16 resulting estimates of β are less than -0.29. That is, even if the actual impact of the hypothetical law on IAR registrations in other Southern states is zero, the DID regression estimates an effect which is more negative than -0.29 half of the time. This indicates that the estimate of -0.29 provides no substantive evidence of the Oklahoma law negatively affecting IAR registrations.

Conclusion

We assess the effect of state-mandated E&O insurance laws for investment advisers on the number of investment adviser representatives registered in Oregon and Oklahoma. The raw number of IARs per 100,000 population increased following the implementation of the law in both states. A standard econometric method which controls for trends in IARs per capita also finds no evidence that the law reduced access to investment advisory services in either state.

###


[1] https://dfr.oregon.gov/business/licensing/financial/securities/pages/investment-advisers.aspx and https://www.law.cornell.edu/regulations/oklahoma/OAC-660-11-7-21.

[2] We identify IARs registered in a state as IARs working at a registered investment adviser with an office located in the state.

[3] The impact of the law, if any, should have revealed itself within a year of the date when the law became effective because investment advisors are required to register with the states annually. We thereby restrict the time period to be 2 years before and after the law's effective date.

[4] The West Census Region is made up of 13 states: Alaska, Arizona, California, Colorado, Hawaii, Idaho, Montana, Nevada, New Mexico, Oregon, Utah, Washington and Wyoming.

[5] While there's some concern of a converging (diverging) gap between the two lines in June 2018 for the control group of all other states (all other Western states), both control groups follow the same general trend as the treated group during the six quarters up to and including June 2018. In contrast, neither control group follows the same trend as Oregon over an earlier period including 2016.

[6] Our results are robust to the length of post-treatment period included in the DID study. The DID estimates based on 6 or 4 quarters after treatment are similar to those using 8 quarters post treatment.

[7] The South Census Region consists of 17 states: Alabama, Arkansas, Delaware, Florida, Georgia, Kentucky, Louisiana, Maryland, Mississippi, North Carolina, Oklahoma, South Carolina, Tennessee, Texas, Virginia, West Virginia.

[8] Our results are robust to the length of post-treatment period included in the DID study for Oklahoma.

Back