To answer that, we examined 194 sets of offering documents for TICs sold from 2004-2009. This totaled $2.2 billion in equity, which amounts to approximately 19% of all equity issued by TICs in that period, and included properties from 32 states.
Year
Name
Issuer
State
Equity (MM)
Year
Name
Issuer
State
Equity (MM)
2004
Southtrust Tower
DBSI
Florida
$34.24
2004
Republic
DBSI
Texas
$18.10
2004
North Valley Tech Center
Argus Realty Investors
Colorado
$20.20
2004
Cypress Pointe IV
Mammoth Equities
California
$14.65
2005
Atlantic Boulevard
DBSI
Florida
$4.99
2005
Friar's Branch Crossing
DBSI
Tennessee
$7.82
2005
Lakeview & Sojourn Centers
DBSI
Texas
$16.65
2005
Renaissance Center
DBSI
Tennessee
$13.21
2005
West Michigan Industrial
Core Realty Holdings
Michigan
$23.60
2005
Westridge Executive Plaza
Core Realty Holdings
California
$8.50
2005
Bridle Creek Apartments
Geneva
Kentucky
$13.79
2005
Honey Creek Corporate Center II
Geneva
Wisconsin
$11.92
2005
Southfield Office Building
TIC Properties
Texas
$8.85
2005
Trafalgar/Avion Acquisition
Cabot
Florida
$10.70
2005
Covington Lansing Acquisition
Direct Capital Securities Inc.
Michigan
$7.38
2005
Covington Montelago Acquisition
Direct Capital Securities Inc.
Texas
$9.72
2005
Thistle Landing
Principle Equity Management
Arizona
$22.35
2005
Baylor Garland Medical Plaza
Rainier Capital Management
Texas
$5.60
2005
Professional Building - Roseville
Mammoth Equities
California
$7.72
2005
Sixth Avenue West
Triple Net Properties
Colorado
$6.60
2005
Woodside Corporate Park
Triple Net Properties
Oregon
$24.65
2005
Legacy
RMC Property
Texas
$9.78
2006
Colonnade at West Lake
DBSI
Texas
$4.95
2006
East 21st Street Buildings
DBSI
Kansas
$11.28
2006
Northpointe Tower
DBSI
Missouri
$6.74
2006
Silver Lakes
DBSI
Florida
$7.10
2006
Bridford Lake Apartments
Core Realty Holdings
North Carolina
$10.13
2006
Brookfield Lakes Corporate Center
Core Realty Holdings
Wisconsin
$32.00
2006
Cardinal Apartments
Core Realty Holdings
North Carolina
$6.34
2006
Chatham Wood Apartments
Core Realty Holdings
North Carolina
$4.39
2006
Hickory Creek Apartments
Core Realty Holdings
Virginia
$10.90
2006
Madison at Adams Farm Apartments
Core Realty Holdings
North Carolina
$11.62
2006
Park West Apartments
Core Realty Holdings
Virginia
$9.89
2006
Riverbend Apartments
Core Realty Holdings
Indiana
$30.50
2006
Sonoma Ridge Apartments
Core Realty Holdings
California
$16.00
2006
Westwind Office Park
Core Realty Holdings
California
$17.48
2006
Griffin Capital (Naperville) Investors
Griffin Capital
Illinois
$14.33
2006
Griffin Capital (Q Street) Investors
Griffin Capital
California
$21.28
2006
Griffin Capital (St. Paul) Investors
Griffin Capital
Minnesota
$19.73
2006
Griffin Capital (Naperville) Investors
Griffin Capital
Illinois
$14.33
2006
Philips Office
Moody National Companies
New Jersey
$21.04
2006
Weatherford Plaza
Moody National Companies
Texas
$9.53
2006
Chesterfield Valley Medical Office Building II
Geneva
Missouri
$8.15
2006
Honey Creek Corporate Center III
Geneva
Wisconsin
$10.45
2006
Acropolis Office Park
TIC Properties
Ohio
$11.95
2006
302 West Third Street
TIC Properties
Ohio
$8.54
2006
116 Defense Highway
Direct Invest
Maryland
$7.62
2006
Triwest Plaza
Argus Realty Investors
Texas
$17.00
2006
Residence Inn by Marriott - Chantilly
Oxford Capital Group
Virginia
$13.05
2006
Oak Grove Acquisition
Cabot 1031
Florida
$8.65
2006
DFW Office/Flex I
Equitable Companies
Texas
$10.85
2006
DFW Office/Flex II
Equitable Companies
Texas
$12.75
2006
Barrett Woods Corporate Center
Exchange Point Properties
Missouri
$9.49
2006
Springs - Office Investors
Meridian
Kentucky
$15.39
2006
Atlanta One
Moody National Companies
Georgia
$7.21
2006
Memphis Residence Inn
Moody National Companies
Tennessee
$6.93
2006
Residence Inn Lebanon
Moody National Companies
New Hampshire
$9.36
2006
Texas Two
Moody National Companies
Texas
$9.30
2006
121 Airport Centre I & II
Principle Equity Management
Texas
$16.87
2006
Business Exchange
Rainier Capital Management
Missouri
$3.19
2006
The Best Western Airport Inn Fort Myers
Gibralter Holdings
Florida
$10.69
2006
Maunakea Marketplace
Gibralter Holdings
Hawaii
$6.30
2006
Pueblo Crossing I
ORIX EMPIRE
Colorado
$6.00
2006
Fountains II And Fountains III
Wilkinson
Illinois
$7.01
2006
State Of Michigan Building
APCA
Michigan
$3.69
2006
RMC AutoSonic BMWN League City
RMC Property
Texas
$9.95
2006
State Farm Insurance Building
TIC Capital
California
$7.05
2006
Rambling Oaks Assisted Living And Rambling Oaks Courtyard
Wilkinson 1031
Oklahoma
$7.20
2006
220 Virginia Avenue
Triple Net Properties
Indiana
$20.76
2006
Las Colinas Highlands
Triple Net Properties
Texas
$15.40
2007
Beacon Point
DBSI
Ohio
$3.60
2007
Colony Commons
DBSI
Texas
$3.67
2007
Goshen Village
DBSI
Indiana
$4.74
2007
Haverford Place
DBSI
Kentucky
$7.15
2007
Park Plaza Retail Center
DBSI
Texas
$8.30
2007
Sherwood Village
DBSI
Texas
$1.94
2007
Shops @ Katy
DBSI
Texas
$4.88
2007
Village at Old Trace
DBSI
Georgia
$9.42
2007
Willow Bend
DBSI
Tennessee
$2.87
2007
Governor's Pointe
Core Realty Holdings
Ohio
$8.13
2007
Hidden Lakes Apartments
Core Realty Holdings
North Carolina
$10.50
2007
Promenade at Northridge
Core Realty Holdings
California
$11.13
2007
Revere Holdings
Core Realty Holdings
Nevada
$17.50
2007
San Antonio Airport Industrial
Core Realty Holdings
Texas
$15.10
2007
Griffin Capital (Independence) Investors
Griffin Capital
Ohio
$13.10
2007
Marriott Courtyard-Columbus Airport
Moody National Companies
Ohio
$10.81
2007
Marriott Courtyard-Columbus Downtown
Moody National Companies
Ohio
$5.85
2007
Marriott Courtyard-Lyndhurst
Moody National Companies
New Jersey
$19.22
2007
Marriott Fairfield Inn Meadowlands
Moody National Companies
New Jersey
$11.51
2007
Marriott Residence Inn-Perimeter Center
Moody National Companies
Georgia
$7.08
2007
Marriott Residence Inn-Torrance
Moody National Companies
California
$23.02
2007
Marriott SpringHill Suites
Moody National Companies
Washington
$5.83
2007
Fairfield Inn Denver (Denver One)
Moody National Companies
Colorado
$8.63
2007
Renaissance Meadowlands
Moody National Companies
New Jersey
$22.39
2007
TownePlace Suites Fort Worth
Moody National Companies
Texas
$4.58
2007
TownePlace Suites Mount Laurel
Moody National Companies
New Jersey
$5.60
2007
Beamer Place Apartments
Geneva
Texas
$10.16
2007
International Market Square
Geneva
Minnesota
$13.63
2007
Carrington Ridge Apartments
TIC Properties
Georgia
$8.55
2007
Duncan Distribution Center
TIC Properties
South Carolina
$7.25
2007
TIC N. Central Dallas Investors
TIC Properties
Texas
$5.95
2007
SBC Fenton
TIC Properties
Missouri
$6.90
2007
NNN 824 North Market Street
Triple Net Properties
Delaware
$15.00
2007
NNN Central Plaza
Triple Net Properties
Arizona
$32.80
2007
NNN Darien Business Center
Triple Net Properties
Illinois
$13.20
2007
NNN Eastern Wisconsin Medical Portfolio
Triple Net Properties
Wisconsin
$12.94
2007
NNN Exchange South
Triple Net Properties
Florida
$12.34
2007
NNN Harbour Landing
Triple Net Properties
Texas
$7.38
2007
NNN Mainstreet at Flatiron
Triple Net Properties
Colorado
$5.85
2007
NNN Old Line Professional Centre
Triple Net Properties
Maryland
$6.65
2007
NNN One Ridgmar Centre
Triple Net Properties
Texas
$11.85
2007
NNN River Ridge
Triple Net Properties
North Carolina
$10.85
2007
NNN Three Resource Square
Triple Net Properties
North Carolina
$11.48
2007
246 Omni Way
Direct Invest
Massachusetts
$12.59
2007
2810 North Parham Road
Direct Invest
Virginia
$7.82
2007
500 East Main
Direct Invest
Virginia
$16.90
2007
Braintree Park
Direct Invest
Massachusetts
$21.94
2007
Cummings Research Park - Portfolio II
Bluerock Real Estate
Alabama
$21.28
2007
Summit at Southpoint
Bluerock Real Estate
Florida
$13.55
2007
Houston Office Buildings
Argus Realty Investors
Texas
$13.62
2007
Hendersonville
Desanto Realty Group
Tennessee
$13.32
2007
Cypress Medical
Desanto Realty Group
Kansas
$10.81
2007
Clearview
Desanto Realty Group
Michigan
$9.91
2007
Fox Chase
Desanto Realty Group
Ohio
$9.77
2007
Perry's Crossing
Desanto Realty Group
Ohio
$10.07
2007
Ashtabula Acquisition
Cabot
Ohio
$15.10
2007
Northpark Southland Acquisition
Cabot
Indiana
$22.00
2007
Creekside Acquisition
Cabot
Georgia
$17.50
2007
Fontaine Business Park
U.S. Advisors
South Carolina
$11.50
2007
Courtyard Matthews & Courtyard Rock Hill
Oxford Capital Group
North Carolina
$10.33
2007
Residence Inn & Courtyard by Marriott
Oxford Capital Group
South Carolina
$11.68
2007
Residence Inn Charleston
Oxford Capital Group
South Carolina
$7.50
2007
SpringHill Suites Riverview
Oxford Capital Group
South Carolina
$5.52
2007
Crystal Lake & Pelican Pointe
Cabot 1031
Florida
$13.00
2007
East Town Acquisition
Cabot 1031
Wisconsin
$7.10
2007
Turfway Ridge Acquisition
Cabot 1031
Kentucky
$11.75
2007
Portland Senior Properties
Christopher Place
Oregon
$4.60
2007
Traverse Bay Senior Properties
Christopher Place
Michigan
$4.00
2007
Mapleridge Shopping Center
Exchange Point Properties
Minnesota
$7.72
2007
Southridge Plaza
Exchange Point Properties
Texas
$6.47
2007
Dobson Ranch
Geyser Holdings
Arizona
$4.90
2007
Yuma
Geyser Holdings
Arizona
$6.00
2007
Johns Creek Office Portfolio
Principle Equity Management
Georgia
$12.64
2007
Technology Parkway Office Portfolio
Principle Equity Management
Georgia
$13.30
2007
University Shopping Center
Principle Equity Management
Texas
$7.56
2007
Enclave Parkway
Creekstone Partners
Texas
$11.54
2007
Woodlands
Creekstone Partners
Texas
$7.36
2007
Vista Ridge
Sequoia
Texas
$9.39
2007
Forum
Sequoia
Texas
$12.00
2007
Kansas City
ORIX EMPIRE
Missouri
$8.60
2007
Battle Creek I
ORIX EMPIRE
Oklahoma
$14.00
2007
Landmark/Laumeier Office Portfolio
Bluerock Landmark
Missouri
$7.53
2007
Colonnade At King'S Grant Shopping Center
Kodiak
North Carolina
$3.85
2007
Hotel Indigo Peachtree Street
Pennbridge Capital
Georgia
$8.40
2007
Selina Plaza
TIC Capital
Florida
$2.54
2007
Northgate Business Center And Blackhawk Corporate Center
Argus Realty Investor
Arizona
$20.55
2007
Laveen Village Marketplace
Passco Companies
Arizona
$8.50
2008
Belton Town Center
DBSI
Missouri
$3.62
2008
Houston Levee Galleria
DBSI
Tennessee
$9.80
2008
Landmark Towers
DBSI
Minnesota
$16.50
2008
North Stafford
DBSI
Virginia
$13.22
2008
Peachtree Corners Pavilion
DBSI
Georgia
$3.95
2008
Pinehurst Square East
DBSI
North Dakota
$10.15
2008
Pinehurst Square West
DBSI
North Dakota
$6.36
2008
Romence Village
DBSI
Michigan
$6.51
2008
Shoppes at Trammel
DBSI
Georgia
$3.72
2008
Wisdom Pointe
DBSI
Georgia
$3.35
2008
Hunters Chase Apartments
Core Realty Holdings
North Carolina
$4.93
2008
Minneapolis Industrial Portfolio
Core Realty Holdings
Minnesota
$14.81
2008
Marriott TownePlace Suites-Portland
Moody National Companies
Maine
$9.69
2008
Cooper Glen Apartments
Geneva
Texas
$6.44
2008
NNN Jacksonville Medical Plaza
Triple Net Properties
Florida
$14.04
2008
NNN Six Forks Station
Triple Net Properties
North Carolina
$11.70
2008
NNN Washington Park
Triple Net Properties
Ohio
$12.07
2008
Heron Cove
Direct Invest
New Hampshire
$10.63
2008
1600 Barberry Lane
Grubb & Ellis
Georgia
$19.07
2008
5001 Enclave
Grubb & Ellis
Texas
$11.22
2008
Oak Park Office Center
Grubb & Ellis
Texas
$18.65
2008
2650 Old Norcross
Grubb & Ellis
Georgia
$13.66
2008
One Live Oak
Grubb & Ellis
Georgia
$17.49
2008
Plantations at Haywood
Grubb & Ellis
South Carolina
$21.36
2008
7207 Snowden Road
Grubb & Ellis
Texas
$12.36
2008
1650 Sunflower
Grubb & Ellis
California
$14.93
2008
5200 Upper Metro
Grubb & Ellis
Ohio
$6.33
2008
IBP
Argus Realty Investors
Texas
$55.00
2008
Hunter'S Chase
Desanto Realty Group
Ohio
$11.44
2008
Evanston Portfolio
Equitable Companies
Illinois
$9.49
2008
Cameron Brook Apartments
Exchange Point Properties
Georgia
$17.17
2008
Showplace
Geyser Holdings
Indiana
$5.59
2008
Madison At Fairwood Apartments
Passco Companies
Washington
$16.90
2008
Algonquin Galleria
Nelson Bros.
Illinois
$9.54
2008
Meadow Green Apartments
Delmar Equity Partners
Texas
$2.40
2008
2801 East Enterprise Drive
Whitecap Real Estate
Wisconsin
$2.38
2009
Keaau Hawaii
Geyser Holdings
Hawaii
$4.33
Showing 1 to 194 of 194 entries
After we compiled this information, a couple of things stood out. We have said before that TICs tend to have high upfront fees. In our database, the average upfront fees totaled 28% (!) of total equity. The lowest upfront fees were a still-high 17%, and the highest was a remarkable 72%. We have also said that TICs tend to be highly leveraged (i.e., use a lot of debt). Some TICs had no leverage, but both the average and median debt-to-equity ratio (total debt / total equity) across our sample was 1.56.
We've also talked about how TICs tend to have low net present values, even taking a sponsor's projected cash flows at face value. When we valued all the sponsor's projections in our database, we found that the average TIC was worth only 83.6 cents on the dollar.1 But were the sponsors' assumptions valid?
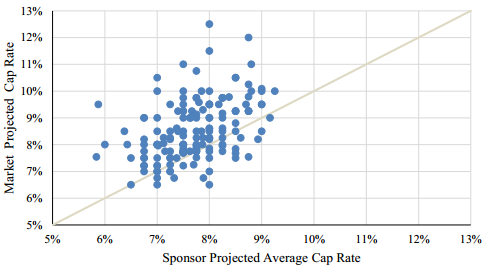
For each property, we compared the cap rate used by the sponsor to cap rates published by a real estate market analysis firm. Cap rates are used to estimate the final value of the property at sale. The lower the cap rate, the higher the resulting property value. We found that sponsors tended to use cap rates that were lower than market rates, inflating the property value at sale, as shown in the figure below (Figure 10 in the paper):
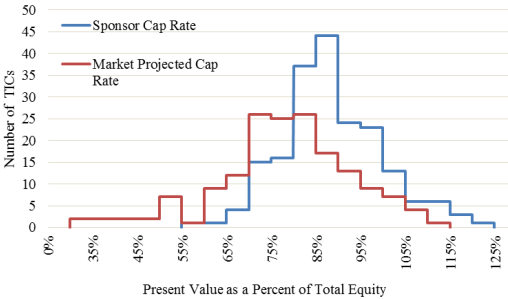
When we value all of the properties using market cap rates rather than those assumed by the sponsors, the average present value drops to 74.5 cents on the dollar. The distributions of present values before (blue) and after (red) correcting the sponsor's caps are shown below (Figure 12 in the paper):
These results suggest that TIC sponsors use aggressive assumptions when preparing cash flow projections for offering materials. These cash flows are the primary justification for projected distributions and investor returns, yet even a relatively straightforward discounted cash flow analysis reveals that most TICs were exceptionally poor investments.
_______________________________________
1 Sponsors often include multiple projections, especially for cap rate assumptions. We valued each of these alternative projections and averaged the resulting values.